02. Motivation for Data Visualization
Summary Statistics vs. Visualizations
Summary statistics like the mean and standard deviation can be great for attempting to quickly understand aspects of a dataset, but they can also be misleading if you make too many assumptions about how the data distribution looks.
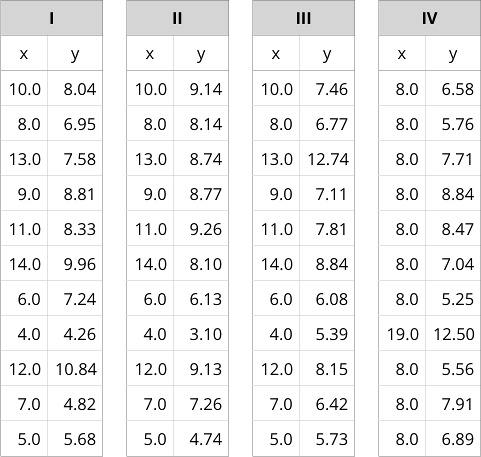
Anscombe's Quartet Example
Consider we have the following four datasets of x, y pairs. You can download the data using the button below. A link to a Google Sheet with the data is also available here.
QUIZ QUESTION::
Use the data above to match an answer to each of the following questions. (Assume rounding to 2 digits)
ANSWER CHOICES:
|
Question |
Answer |
|---|---|
What is true for the means associated with any of the X columns? |
|
What is true for the means associated with any of the Y columns? |
|
What is true for the standard deviation associated with any of the X columns? |
|
What is true for the standard deviation associated with any of the Y columns? |
SOLUTION:
|
Question |
Answer |
|---|---|
|
What is true for the means associated with any of the X columns? |
|
|
What is true for the means associated with any of the Y columns? |
|
|
What is true for the standard deviation associated with any of the X columns? |
|
|
What is true for the standard deviation associated with any of the Y columns? |
|
|
What is true for the means associated with any of the X columns? |
|
|
What is true for the means associated with any of the Y columns? |
|
|
What is true for the standard deviation associated with any of the X columns? |
|
|
What is true for the standard deviation associated with any of the Y columns? |